|
Views: 2524
|
Replies:0
|
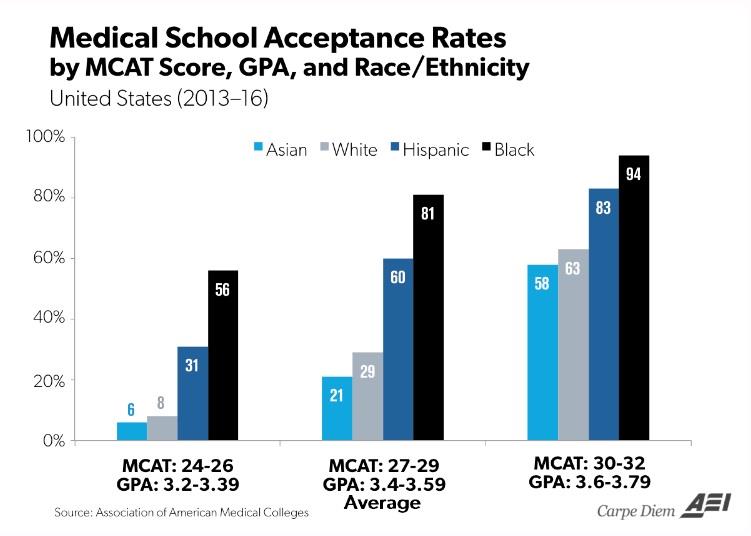
New chart illustrates graphically the racial preferences for blacks, Hispanics being admitted to US medical schools
By Carpe Diem
|
|
OP
06/28/2017
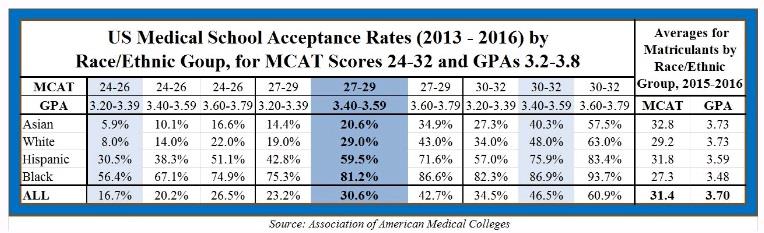
The bar chart above is based on selected data from the table below the chart and shows the acceptance rates for US medical schools based on three different combinations of MCAT scores and GPA by ethnic/race group during the 2013-2016 period. As I explained in previous CD post that featured the table above (but not the new bar chart, which was just prepared with assistance from Olivier Ballou): For the 2015-2016 academic year, the average GPA of all students applying to medical schools was 3.55 and the average MCAT score was 28.3 according to data from the Association of American Medical Colleges (AAMC). The highlighted dark blue column in the middle of the table above displays the acceptance rates to US medical schools for applicants from four racial/ethnic groups for applicants with: a) GPAs that fall in the 3.40 to 3.59 range that includes the average GPA of 3.55 and b) MCAT scores in the range between 27 to 29 that includes the average MCAT score of 28.3. Acceptance rates for students with slightly higher and slightly lower than average GPAs and test scores are displayed in the other columns. In other words, the table above displays acceptance rates by race/ethnicity for students applying to US medical schools with average academic credentials, and just slightly above and slightly below average academic credentials.
Bottom Line: Medical school acceptance rates in recent years suggest that medical schools must have “affirmative discrimination” and “racial profiling” admission policies that favor black and Hispanic applicants over equally qualified Asian and white students. Even if factors other than GPA and MCAT scores (which are probably the two most important ones) are considered for admission to medical school, wouldn’t it still be very hard to conclude that admissions policies to medical schools are completely “race-neutral” and completely free of any “racial profiling” practices that favor blacks and Hispanics over equally qualified Asians and whites? Here’s why the issue is important: In some states like California, Washington, Florida, Texas, Oklahoma, New Hampshire, and Michigan, racial preferences in college admissions to public universities are currently prohibited by state law. For example, Proposal 2 in Michigan, which was passed into Michigan Constitutional law by a 58% margin of voters in 2006 (and upheld by the Supreme Court in 2014), states:
Note: Unfortunately, it might difficult to get these exact data on medical school admissions by race/ethnic group and GPA/MCAT score in the future for the following reasons: 1. The MCAT test was recently re-scaled from the tradition point range of 20-35 to a new scale that ranges from 475 to 525 points, and that change was in effect for the most recent AAMC report on Applicants and Matriculants Data for the 2016-2017 academic year. In the past, the AAMC would report the data on acceptance rates by GPA/MCAT scores and race/ethnic group over the most recent three-year period, so it might wait for several more years before it would have three years of data under the new MCAT test score range. 2. The AAMC this year also hasn’t yet reported acceptance rates for the 2016-2017 academic year based on various combinations of GPA/MCAT score by race/ethnic group like it has in the past. It’s possible there’s a delay in reporting these data, and it’s also possible the traditional “grid report” on GPA and MCAT scores by race/ethnic groups may no longer be reported as it was in past years?
0
0
Recommended |
|

 Justice Dept. investigating Harvard over affirmative action policies